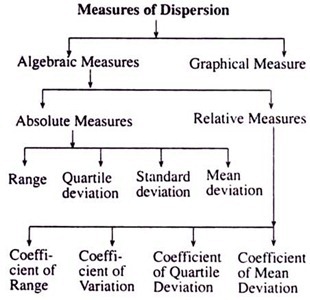
Measurement of Dispersion
Dispersion:
Dispersion is the measurement of fluctuation of data or scatterness of data.
Important concept: 
(1) Range:
Formulas of Range
Range = Maximum value - Minimum Value
Coefficient of Rnage =
(Maximum value - Minimum Value)/(Maximum value + Minimum Value)
(2) Quartile Deviation : Quartile Deviation is also known as semi-inter Quartile range. This is the best measurement of
Dispersion in the case of open-end data. It is denoted by Q.D.It is depends on middle 50% of values.
Q
3 -
Q
1 = inter-quartile range.
(Q
3 - Q
1)/2 = semi-inter quartile range or quartile deviation.
Coefficient of Q.D. = (Q
3 - Q
1)/(Q
3 + Q
1)
where Q
1 = lower quarile, Q
3 = upper quartile
(3) Mean Deviation :
The mean deviation (also called the mean absolute deviation) is the mean of the absolute deviations of a set of data about
the data's mean.
Mean Deviation can be calculated from mean, median and mode.The value of M.D. will be minimum when it calculated from median.
formulas:
|
M.D. from x̅ |
M.D. from Md |
M.D from Mo |
| Raw Data |
1/n ∑lx- x̅l |
1/n ∑lx- Mdl |
1/n ∑lx- Mol |
| Ungrouped Data |
1/∑f ∑flx- x̅l |
1/∑f ∑flx- Mdl |
1/∑f ∑flx- Mol |
| Grouped Data |
1/∑f ∑flx- x̅l
x = mid-point |
1/∑f ∑flx- Mdl
x = mid-point |
1/∑f ∑flx- Mol
x = mid-point |
| Coefficient of M.D |
M.D. from x̅/ x̅ |
M.D. from Md/ Md |
M.D. from Mo/ Mo |
(4) Standard Deviation : The standard deviation measures the spread of the data about the mean value. It is
denoted by S.D. or small sigma. S.D. is the best measurement of dispersion, has wide applications.
Formulas
| Raw Data |
√[ 1/n ∑(x-x̅)
2] |
√[ 1/n ∑x2
- (x̅)2] |
√[ 1/n ∑x2
- (∑x/n )2] |
| Ungrouped Data |
√[ 1/∑f ∑f(x-x̅)
2] |
√[ 1/∑f ∑fx2
- (x̅)2] |
√[ 1/∑f ∑fx2
- (∑fx/∑f )2] |
| Grouped Data |
√[ 1/∑f ∑f(x-x̅)
2]
x = mid-point |
√[ 1/∑f ∑fx2
- (x̅)2]
x = mid-point |
√[ 1/∑f ∑fx2
- (∑fx/∑f )2]
x = mid-point |
Formula of Combined Standard Deviation:

where s
1 = standard deviation of group 1,
s
2 = standard deviation of group 2.
Cofficient of variation(C.V.)It is always represnted by percentage . The data which has less C.V. will be more consistant
and vice-versa
Formula
S.D./mean
x 100
Note: Measurement of dispersion has no impact of change of origin
while it has impact of change of scale.


